Definition of each stage of systemic metabolic disorder
SMD components often occur together and influence each other, so a holistic approach is needed.
A staging system helps guide management:
| Stage 1 | is defined as the presence of (i) insulin resistance/pre-diabetes alone or (ii) overweight/dysfunctional adiposity and at least one of the following traits: isolated liver steatosis, hypertension, or atherogenic dyslipidaemia |
| Stage 2 | is defined as Type 2 diabetes, asymptomatic diastolic dysfunction, MASH/fibrosis, albuminuria or CKD Categories 1–2, or sub-clinical atherosclerosis with no history of events |
| Stage 3 | is defined as symptomatic HFpEF, cirrhosis/liver failure, reduced kidney function/failure and CKD Categories 3–5, or clinical manifestation of ASCVD |
Using this system in the UK Biobank (ages 40–69):
- Stage 1 SMD was found in 58% of participants.
- Most common features: overweight (96%) and dyslipidaemia (91%), followed by liver steatosis (52%) and hypertension (48%).
- Only 18% had pre-diabetes; insulin resistance was likely higher but not fully captured.
- Most Stage 1 participants had both overweight and dyslipidaemia, with fewer having additional features like liver steatosis and hypertension.
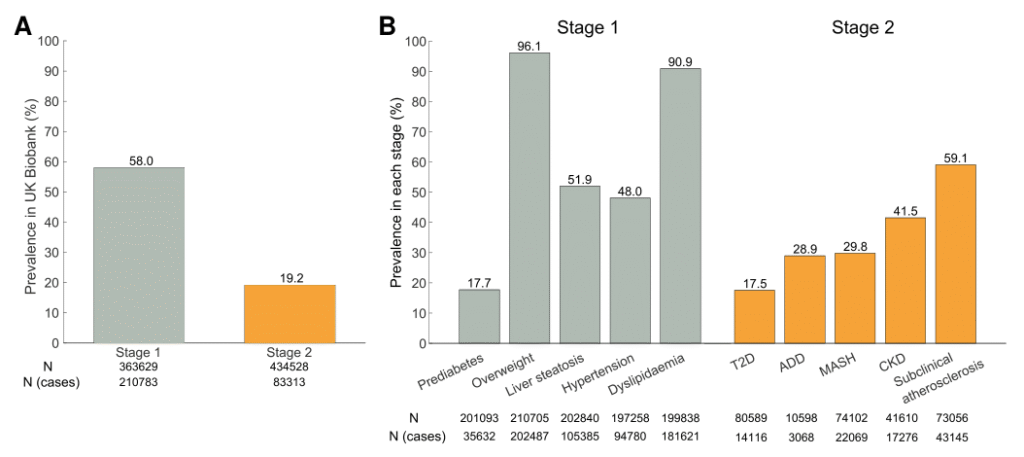
Figure 2
Prevalence of systemic metabolic disorder Stages 1 and 2 among Europeans from the UK Biobank. (A) Stage 1 was defined as individuals with pre-diabetes alone (HbA1c 39 to ≤47 mmol/mol; fasting insulin measurements were not available) or overweight (either body mass index ≥25 or waist circumference ≥88/102 cm female/male) with at least one of the following conditions: liver steatosis (fatty liver index ≥60), hypertension (systolic blood pressure >140 or diastolic blood pressure >90 mmHg), and dyslipidaemia [non-fasting circulating triglycerides ≥2.0 mmol/L (177 mg/dL) or non–HDL-cholesterol ≥3.4 mmol/L (131 mg/dL) or apolipoprotein B ≥3.9 µmol/L (100 mg/dL)]. Individuals taking anti-hyperglycaemic medications or with self-reported diabetes at baseline were excluded from Stage 1. Stage 2 was defined as individuals with at least one of the following conditions: Type 2 diabetes (HbA1c ≥48 mmol/mol), asymptomatic diastolic dysfunction (B-type natriuretic peptide or N-terminal-pro-B-type natriuretic peptide plasma Normalized Protein eXpression levels ≥95th percentile), metabolic-associated steatohepatitis/fibrosis (Fibrotic NASH Index score >0.33), albuminuria and chronic kidney disease Categories 1–2 (estimated glomerular filtration rate ≥60 mL/min per 1.73 m2 and urine albumin-to-creatinine ratio 3–29 mg/mmol), or atherosclerosis with no history of events (5 ≤ Systematic Coronary Risk Evaluation < 10% using the coefficients corresponding to low-risk individuals). Individuals who met the criteria for both stages were excluded from Stage 1. (B) Prevalence of each condition within individuals with either systemic metabolic disorder Stage 1 or 2. T2D, Type 2 diabetes; ADD, asymptomatic diastolic dysfunction; MASH, metabolic-associated steatohepatitis; CKD, chronic kidney disease.
Stage 2 SMD was seen in 19% of the UK Biobank population.
Key features:
- Sub-clinical atherosclerosis: 59%
- Chronic kidney disease (CKD): 42%
- Metabolic-associated steatohepatitis (MASH): 30%
- Asymptomatic diastolic dysfunction: 29%
- Type 2 diabetes: 18%
Most organ damage affected only one organ, often reflecting individual genetic/epigenetic vulnerability. Common combinations included Type 2 diabetes and MASH.
- Stage 1 may be reversible with lifestyle changes.
- Stage 2 indicates increased inflammation and cellular injury, leading to early fibro-inflammatory changes.
Mortality risk: Stage 1 → 6% increase; Stage 2 → 49% increase over ~15 years.
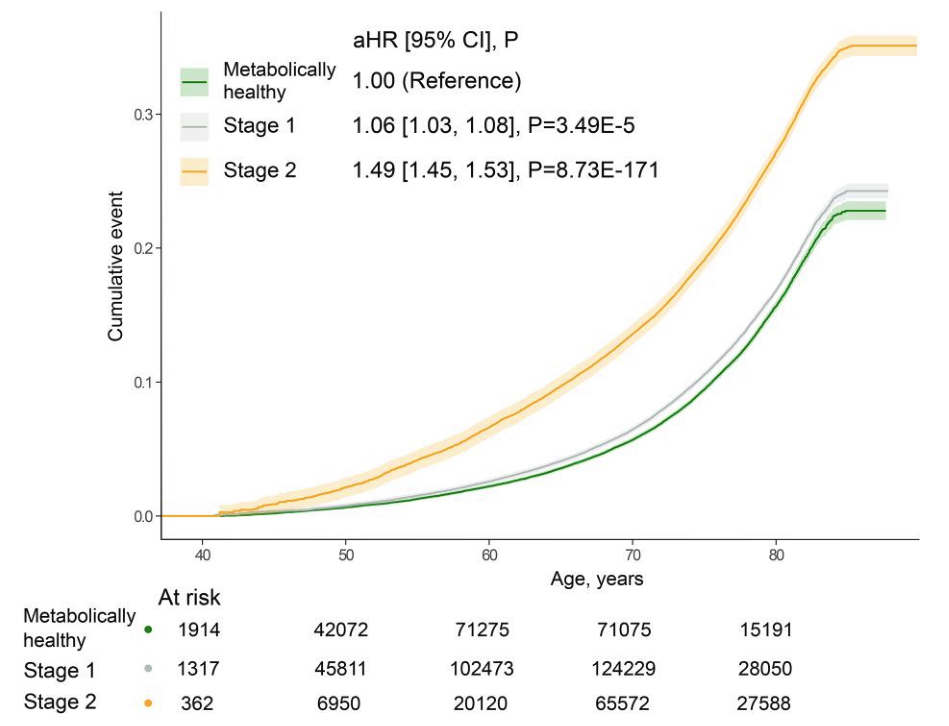
Figure 3
Kaplan–Meier estimates of cumulative events for all-cause mortality among Europeans in the UK Biobank with or without systemic metabolic disorder Stages 1 or 2. The defining criteria used here for Stages 1 and 2 are described in the legend in Figure 2. Individuals who met the criteria for both stages were excluded from Stage 1. All-cause mortality was defined using the date of death from record linkage to Hospital Episode Statistics (England and Wales) and Scottish Morbidity Records. Follow-up began at the date of baseline assessment visit and ended at the date of death, loss to follow-up, or censoring date (31 October 2022, https://biobank.ctsu.ox.ac.uk/crystal/exinfo.cgi?src=Data_providers_and_dates), whichever happened first. The median follow-up period was 14.95 years (interquartile range 14.94–14.95). Hazard ratios with 95% confidence intervals were calculated using Cox proportional hazard models for Stages 1 (grey) and 2 (orange) vs metabolically healthy (green), adjusted for age and sex. aHR, adjusted hazard ratio; CI, confidence interval.
Defining criteria for each stage of systemic metabolic disorder
The defining criteria for each SMD stage and the clinical variables that should be measured in a person with SMD are summarized in Figures 4–6. Below, we describe the diagnostic tools and/or biomarkers that can be used to assess each SMD component.
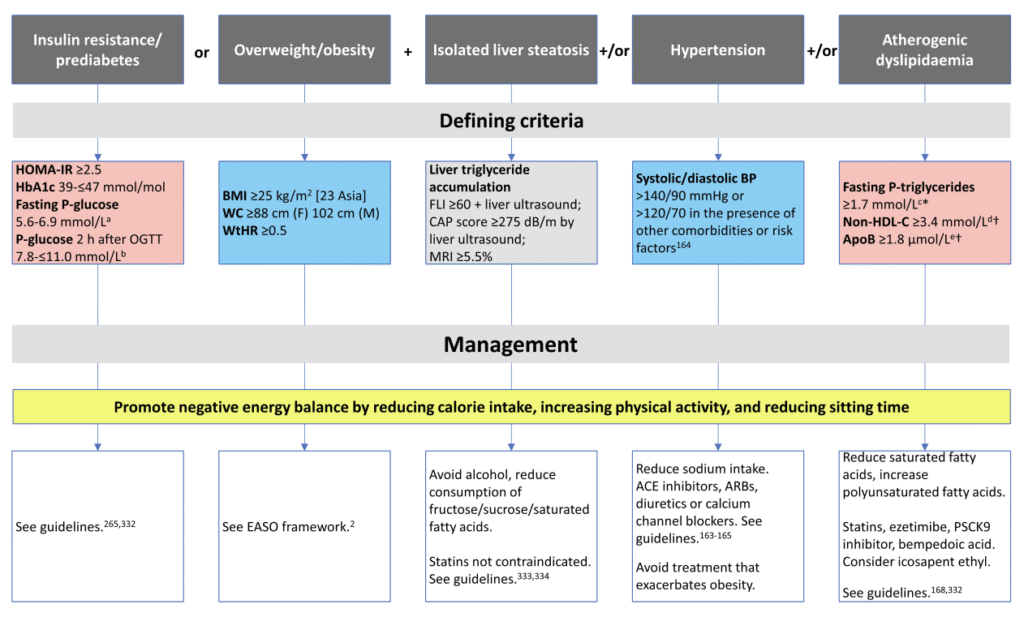
Figure 4
Defining criteria and potential management strategies for systemic metabolic disorder Stage 1. Conventional units: a101–124 mg/dL; b141 to ≤198 mg/dL; c150 mg/dL; d131 mg/dL: e100 mg/dL. *Non-fasting P-triglycerides ≥2.0 mmol/L (177 mg/dL). †Values shown for individuals at moderate risk of atherosclerotic cardiovascular disease. For those at high risk of atherosclerotic cardiovascular disease, lower thresholds apply: non–HDL-cholesterol ≥2.6 mmol/L (100 mg/dL); apolipoprotein B ≥1.5 µmol/L (≥80 mg/dL). P, plasma; WC, waist circumference; WtHR, waist-to-height ratio; EASO, European Association for the Study of Obesity; FLI, fatty liver index; CAP, controlled attenuation parameter; MRI, magnetic resonance imaging; BP, blood pressure; C, cholesterol; ACE, angiotensin-converting enzyme; ARB, angiotensin-II receptor blocker
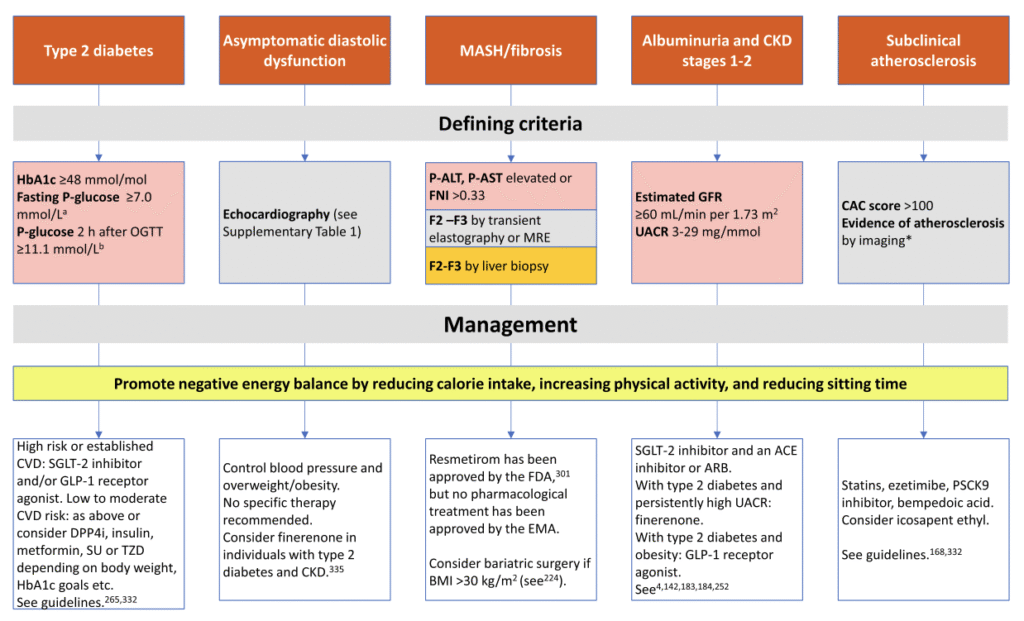
Figure 5
Defining criteria and potential management strategies for systemic metabolic disorder Stage 2. Conventional units: a126 mg/dL; b200 mg/dL. *Presence of plaques by coronary computed tomography angiography or peripheral atherosclerosis by ultrasound or angiography. P, plasma; CVD, cardiovascular disease; DPP4i, dipeptidylpeptidase-4 inhibitor; SU, sulfonylureas; TZD, thiazolidinediones; CAC, coronary artery calcium; CKD, chronic kidney disease; FNI, Fibrotic NASH Index; MRE, magnetic resonance elastography; FDA, US Food and Drug Administration; EMA, European Medicines Agency
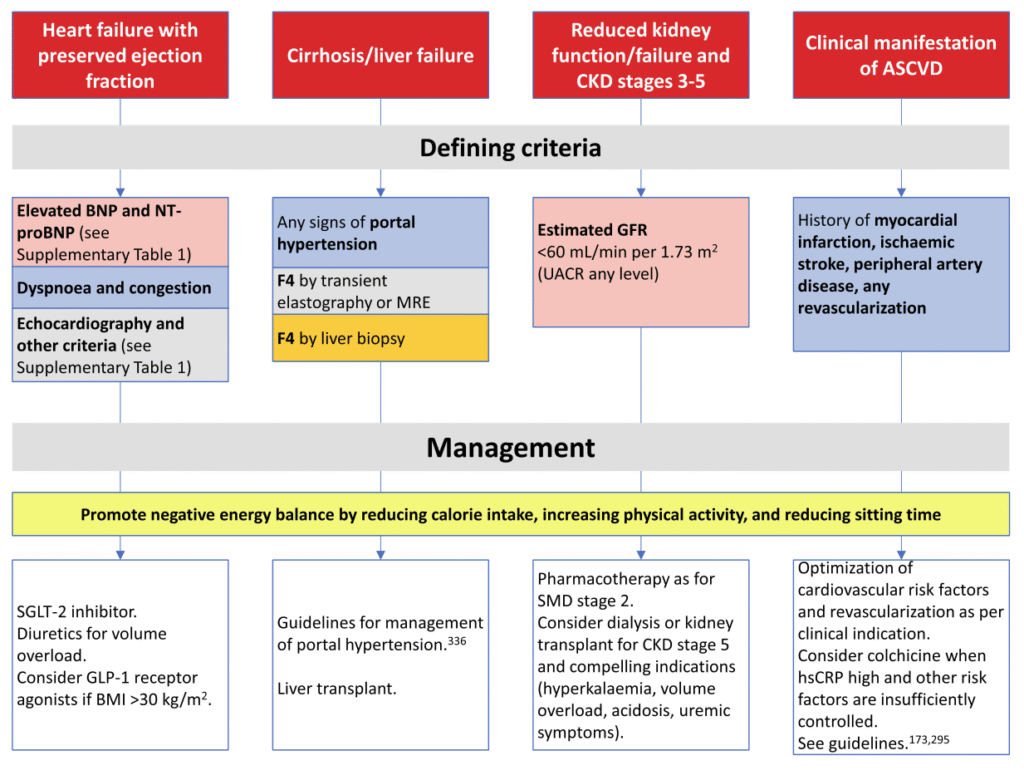
Figure 6
Defining criteria and potential management strategies for systemic metabolic disorder Stage 3
Insulin resistance, pre-diabetes, and Type 2 diabetes
The gold standard to measure insulin resistance, the hyperinsulinaemic-euglycaemic clamp, is impractical for routine use. Instead, surrogate markers are used:
HOMA-IR: fasting insulin × fasting glucose ÷ 22.5; ≥2.5 indicates insulin resistance.
Other markers: triglyceride-glucose index and triglyceride/HDL ratio, both linked to cardiovascular risk.
Pre-diabetes and Type 2 diabetes can be diagnosed via: HbA1c, fasting glucose, or OGTT (glucose test after 2 hours).
Pre-diabetes is an easily measurable sign of insulin resistance but not all insulin-resistant individuals have dysglycaemia.
Recommendation: use HOMA-IR alongside HbA1c to detect early-stage SMD.
Overweight/obesity
Excess body fat is usually measured by BMI: ≥25 kg/m² = overweight, ≥30 kg/m² = obesity. For Asian populations, BMI ≥23 kg/m² defines overweight due to higher metabolic risk at lower BMI.
Limitations of BMI:
- Doesn’t show fat distribution or lean mass.
- Waist circumference or waist-to-height ratio gives better risk information.
New frameworks (EASO & Lancet Commission)
- Treat obesity as an adiposity-based chronic disease.
- Diagnosis should combine anthropometric measures (BMI + waist-to-height ratio) with clinical assessment of health impact.
- “Pre-clinical obesity”: excess fat without organ dysfunction but increased risk.
- “Clinical obesity”: excess fat causing symptoms or organ effects.
Recommendation: measure BMI plus at least one other anthropometric measure (preferably waist-to-height ratio), considering ethnic-specific cut-offs.
Isolated liver steatosis and metabolic-associated steatohepatitis
Liver fat and damage can be assessed in several ways:
- Ultrasound: widely available, easy to use, but qualitative and not very accurate.
- Fatty Liver Index (FLI): uses BMI, waist, triglycerides, and GGT to identify who needs further imaging.
- Controlled Attenuation Parameter (CAP): ultrasound-based, quantitative measurement of liver fat.
- Magnetic Resonance Imaging (MRI): precise measurement of liver triglycerides, but limited to specialized centers.
Liver function and fibrosis:
- Blood tests can screen for damage.
- Non-invasive scores like the Fibrotic NASH Index (FNI) can detect MASH and monitor improvement.
- Fibrosis can also be measured by transient elastography, MR elastography, or biopsy.
- Liver biopsy is the gold standard but is invasive and carries some risk.
Hypertension
Hypertension is defined as a blood pressure of SBP ≥140 mmHg or DBP ≥90 mmHg. The 2024 ESC guidelines also introduce elevated blood pressure (SBP 120–139 or DBP 70–89 mmHg) to highlight that cardiovascular risk increases continuously. Risk should be assessed alongside other factors, as even slightly elevated blood pressure can be concerning if multiple risk factors are present.
Atherogenic dyslipidaemia, atherosclerosis, and atherosclerotic cardiovascular disease
Atherogenic dyslipidaemia can occur even with normal LDL-cholesterol. ApoB is a better marker of total atherogenic particles and cardiovascular risk than LDL or non-HDL cholesterol and is recommended for assessment in SMD.
Sub-clinical atherosclerosis is common in middle-aged adults and can help identify individuals at higher risk than traditional risk models suggest. It can be detected non-invasively using ultrasound, coronary CT, or coronary artery calcium (CAC) scoring, with CAC >100 indicating elevated 10-year ASCVD risk. These measures help guide clinical decisions and risk stratification. The clinical manifestation of ASCVD is defined according to the criteria listed in Figure 6.
Asymptomatic diastolic dysfunction and heart failure with preserved ejection fraction
Asymptomatic diastolic dysfunction is detected by specific echocardiographic findings (see Supplementary data online, Table S1).
Heart failure with preserved ejection fraction (HFpEF) is diagnosed when a patient has heart failure symptoms, left ventricular ejection fraction ≥50%, and evidence of diastolic dysfunction or elevated filling pressures, often supported by BNP/NT-proBNP levels. Diagnosis is challenging, especially in obesity, because symptoms, imaging, and biomarkers can be misleading. Sometimes invasive or exercise testing is needed, and other conditions that mimic HFpEF must be excluded.
Albuminuria, estimated glomerular filtration rate, and chronic kidney disease
Guidelines recommend checking urine albumin-to-creatinine ratio (UACR) and estimated glomerular filtration rate (eGFR) at least once a year—and more frequently for higher-risk patients—to monitor kidney function and guide heart and kidney disease treatment.